Historically, September is one of the worst months of the year for equity markets in the United
States and Australia.
However, just to show that long term trends are not etched in steel, both the US and Australian
markets showed broadly positive performances for September, with no signs that the current
bullish optimism is waning.
In the US, the prime driver for this bullishness was confirmation of the first interest rate cut post
the recent interest rate tightening cycle; a healthy 0.5%. This was facilitated by a fall in the US
inflation rate down to 2.5% in August from 2.9% in July. US inflation appears to be tracking towards the Fed’s longer-term target of 2.0%. Despite softening inflation, economic data continues to suggest the US economy is motoring along quite nicely.
By contrast, Australian economic news was more neutral, and our Reserve Bank has made it clear that we should not expect any interest rate relief until 2025. With interest rates the RBA’s only anti-inflation tool against continued fiscal stimulation by state and our federal governments, the RBA has conveyed it had no intention of blinking and succumbing to political pressure.

Nevertheless, our main indices in the All Ordinaries and ASX 200 index both delivered a strong
performance, gaining 2.7% and 2.2% respectively.
On a sector basis, the standout performer for the month was Materials, as the long-awaited switch from financials to resources finally materialising. The catalyst for this switch was renewed optimism for higher commodities demand, following a late September announcement that the Bank of China planned extensive stimulus measures aimed at revitalizing China’s slowing economy.

This stimulus package, purportedly the largest since the Covid pandemic, contained measures to lower borrowing costs, inject additional liquidity into the financial system, and ease the mortgage repayment burden for households. Whether this stimulus package is more window dressing than substance remains to be seen but, at the tail end of September, it certainly revitalised the resource sector of our share market.
These moves by China also had the immediate effect of arresting a decline in iron ore prices, which had fallen to a two year low of around $US90/tonne. At the same time, sentiment towards base metals and even lithium changed for the better and prices for these commodities rose.

Whilst these price increases were significant in themselves and were the catalyst for the materials index gaining 11.0%, the potential for further upside is still substantial. This is ably demonstrated in Table 2, where the fourth column measures the respective metals price performance from the highs achieved in 2022.
In previous monthly letters we have discussed the recent underperformance of resource stocks relative to the broader ASX 200, and we believe that what we saw towards the latter part of September is the start of this catch-up.
To position portfolios to this expected out performance by resources we have produced a Resources Report that summarises our key stock picks across our key bulk and metal commodities including BHP, South 32, Nickel Industries, Boss Energy and Capstone Copper. If this aspect of the share market interests you, please contact our office to discuss.
Whilst on resources, the oil price remains a laggard and has weakened further over the past few weeks. This is despite continued fighting in the Middle East and concerns that as the conflict potentially widens, oil supplies from the Middle East and, particularly Iran, would become restricted.
However, to date reduced consumer demand, continued record production from the United States and over production from OPEC, has nullified these concerns.
To investigate the extent that the oil price is seasonal, consider the chart below of the oil price over the last three years (Chart 3). Interestingly, we note that over this period, cyclical price lows always occurred through the October-December quarter before a recovery rally commenced either late in December or early January. Perhaps this is a function of northern hemisphere countries stocking oil well in advance of winter and the replenishing oil supplies as the winter progresses subsequently supports the oil price.

Whether 2024 follows this pattern remains to be seen, but the current price weakness in oil seems to be following the above pattern so we could well see an oil price rally later in this quarter into January 2025.
As one would expect, these apparent seasonal rallies have assisted the share price performance of our major oil and gas companies. As an example, Santos saw its share price rally by 16% in January 2022, 4% in January 2023 and 15% in January 2024.
Stocks to watch this time around include Santos, Woodside, Beach Energy and Worley Limited.
(Although Worley is an engineering group, it is reliant on the energy sector for a significant part of its business).
Before we leave our discuission on resources, it is worth noting the opportunity we see in uranium companies.
After experiencing a protracted price slump following reduced demand caused through negative sentiment after the tsunami induced Fukushima reactor leak in 2011 which included Germany closing its nuclear plants, the uranium price has started what appears to be a sustainable recovery from its lows of around $US20/lb in 2018.

This bounce is a result of the realisation renewables will not be the complete energy solution of the future and consequently, nuclear power is increasingly being considered as part of a sustainable low carbon future energy mix.
Years of mothballed production and underdevelopment of new mines has created the situation where the supply of new uranium becomes finely balanced towards the back end of this decade with supply shortages a real possibility.
The World Nuclear Association (“WNA”) predicts world reactor requirements to increase to 83,840 tonnes of uranium by 2030 and almost 130,000 tonnes by 2040.
This contrasts to uranium production currently running at approximately 65,000 tonnes per annum, with the supply shortfall currently being made up from the sale of stockpiled uranium, largely from Russia. Given the long lead time for new mines to commence production, according to the WNA, production is unlikely to significantly increase between now and 2030.
Another factor in the rising consumption of uranium is the added energy requirements for data
centres caused through the widening use of artificial intelligence. Recently, Microsoft has done a deal to bring the shuttered 835-megawatt Three Mile Island nuclear power station’s Unit 1 back online after being out of service for the last 5 years.
These factors combined have propelled the price of uranium to over $US80lb earlier this year, its highest level since 2007.
Our favoured uranium producer is Boss Energy (“BOE”). BOE owns the Honeymoon uranium project located in South Australia and 30% of the Alta Mesa uranium project located in Texas. Honeymoon, with uranium resources of 71.6 million lbs (“Mlbs”), commenced production in April of this year and Alta Mesa, with current resources of 20Mlbs, recommenced production in July 24.
The Market in October
For October and leading through to Christmas, we think it is likely there will be an increasing focus on resource companies, and consequently they could be expected to outperform the broader industrial and financial sectors.
We do however remain cautious for a modest correction. The reason for this caution is the
escalation in fighting the Middle East and the lead up to the US election on 5 November which has, in the past, lead to a small retracement in share markets.

The monthly seasonality analysis (Chart 4) partly supports this caution. But once we are through the current period, which coincides with the US election, history suggests we are coming into the strongest time of the year for equity market performance. As Chart 4 shows, November through to February shows a greater probability of being positive rather than negative, with potential gains historically averaging around 5% over this period.
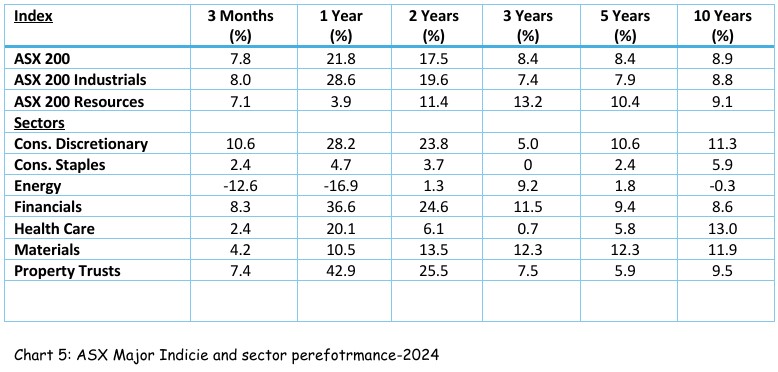
Our final discussion point for this month is the comparative performance of our three major indices and seven main market sectors over the short, medium, and long-term.
Pleasingly, it shows that overall market performance is positive (and significantly above other asset classes). However, the disparity of relative performance across these indices and sectors does show that to maximise potential returns, it is important to review portfolios and counterbalance to reflect those sectors expected to outperform into the future.
As always, please do not hesitate to contact your financial advisor to discuss any of the themes or stocks mentioned in this monthly letter. We appreciate feedback on whether you are finding the monthly letters of interest or would like to see changes made on how it is presented or topics discussed.

